

Ohr initiated this study with the client to demonstrate how the placement and stacking of materials on the factory floor could significantly affect engineering requirements and construction costs. By examining the proposed operations together, we helped the client make informed choices about the investment in their new facility.
01 / Establish the operational needs
Establishing the floor loads
Work with the client to understand where materials would be stored, how they would be stacked and the weights the floor would need to support.
Ohr established the floor loads from the coil-stacking arrangements provided by the client, translating the proposed storage requirements into a basis for structural design.
FIGURE 01 / CLIENT'S STACKING ARRANGEMENTS
Block D & E · Raw-material storage
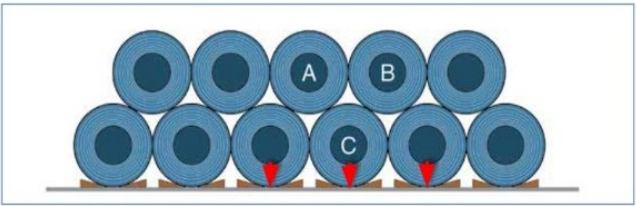
x = 1,524 mm
y = 1,219 mm
x = 1,219 mm
y = 1,219 mm
Block F · Raw-material storage
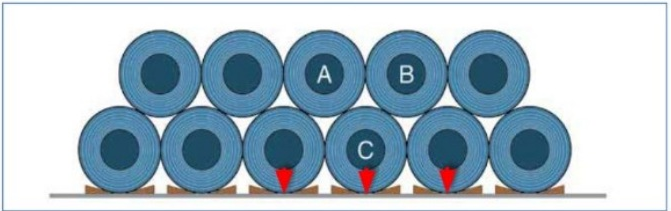
x = 1,980 mm
y = 1,219 mm
x = 1,524 mm
y = 1,219 mm
02 / Show the engineering implications
Assessing how the floor space would be used
Translate the proposed arrangements into floor loads, then assess how different choices affect slab depths, pile sizes, pile spacing and estimated construction costs.
Ohr assessed how the proposed use of the floor space—for raw-material storage, production and finished goods—affected the design requirements and subsequent construction costs.
FIGURE 02 / FLOOR USE AND BAY DEFINITIONS
Scroll across the plan to inspect the detail →
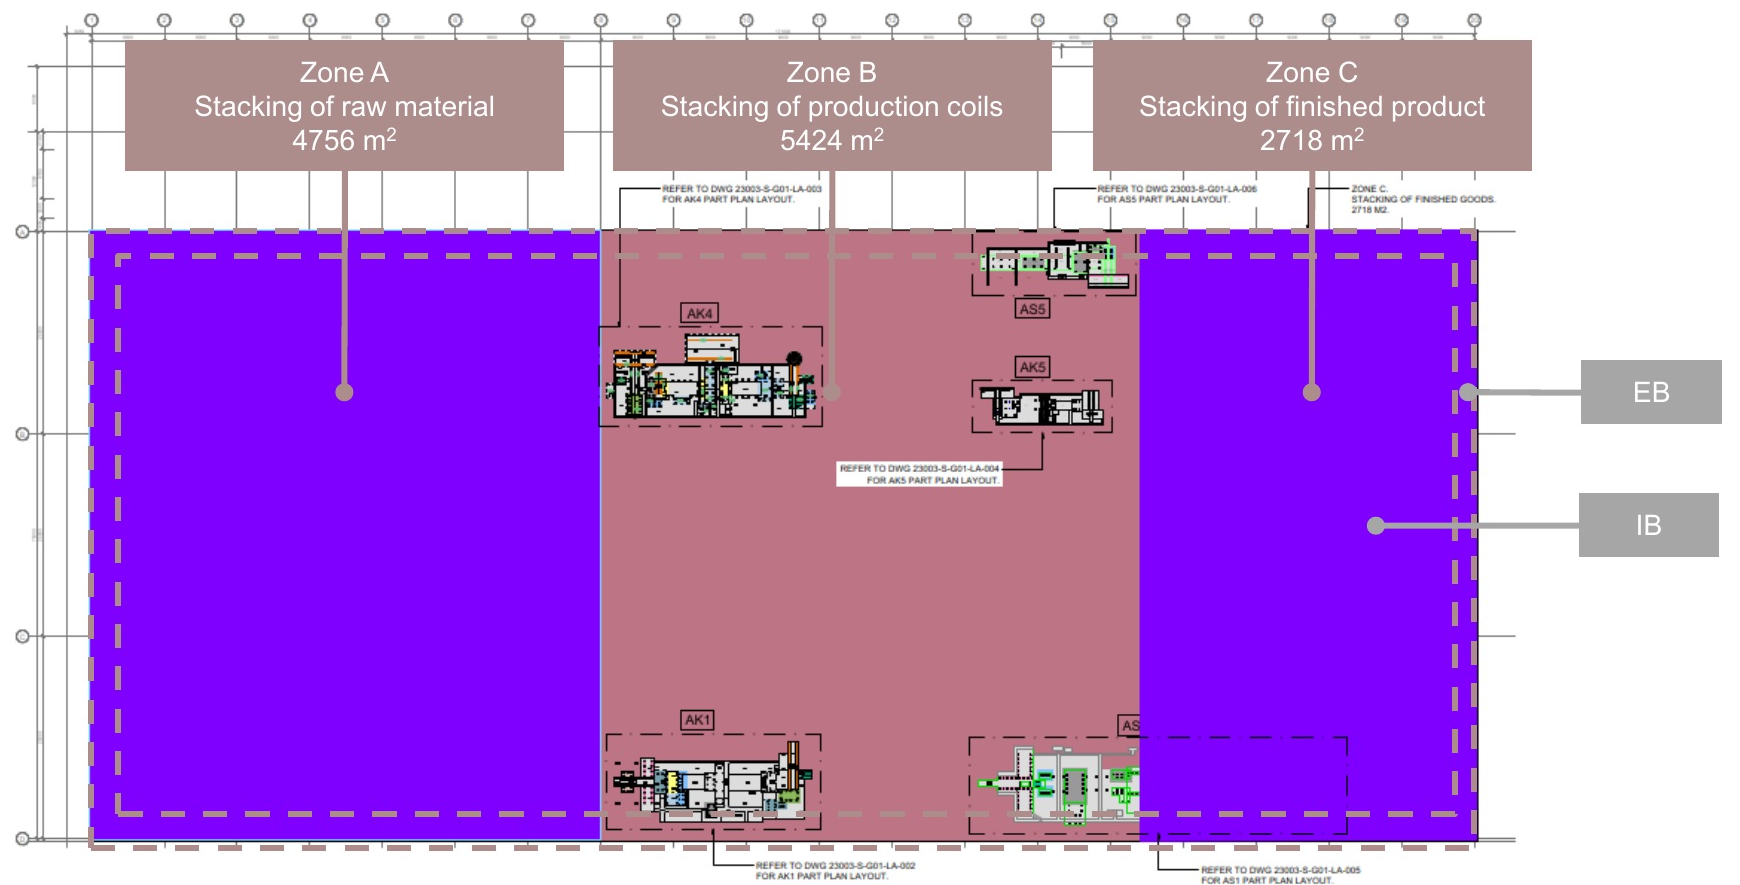
Perimeter bays (EB): the first two bays from the building perimeter. Internal bays (IB): the rest of the floor. EP and IP denote the piles supporting perimeter and internal bays respectively.
Material placement shapes the design
These three examples show how alternative coil-stacking requirements changed the slab and foundation solution and its estimated cost.
FIGURE 03 / COMPARATIVE DESIGN-STAGE STUDY
Scroll across to compare all three options →
| Zone A Raw-material storage | Two-tier stackingSource option 1 | Heavier two-tier stackingSource option 3 | Heavier three-tier stackingSource option 5 |
|---|---|---|---|
| Stacking arrangement | 15-tonne coils below 10-tonne coils above | 25-tonne coils below 15-tonne coils above | 25-tonne coils below Two tiers of 15-tonne coils above |
| Imposed load · kN/m² | 134 | 165 | 226 |
| Pile grid · m | 2.25 × 2.25 | 2 × 2 | 2 × 2 |
| Slab thickness · mm Internal / perimeter bays | 225 / 275 | 200 / 250 | 250 / 325 |
| Square precast piles · mm Internal / perimeter | 350 / 400 | 350 / 400 | 450 / 450 |
| Floor slab · RM/m² | 477 | 481 | 572 |
| Piling · RM/m² | 1,831 | 2,241 | 4,112 |
| Slab + piling · RM/m² | 2,308 | 2,723 | 4,684 |
Dimensions are shown as internal / perimeter. All piling is square precast concrete. Costs are indicative study estimates, not current quotations.
The study made the connection between storage arrangements, floor loading and construction provision tangible.
These options provide different storage capacities; the cost differences are not like-for-like savings or savings realised in construction.
03 / Support an informed investment
Supporting an informed decision
Give the client a clear comparison of operational capacity and construction cost, so the design brief reflects considered choices about the new facility.
Ohr presented the study table to the client, bringing together the loading options, slab and pile requirements, and estimated costs to support an informed decision on the design requirements.
Full supporting schedule · Zone A and Zone B
The complete schedule from the third source visual is reproduced below. Shaded Zone A rows are the three examples compared above. The other source options are retained for context.
Zone A · Stacking of raw material
Source cost-schedule floor area: 4,725 m²
Scroll across for component costs and totals →
| Option | Coil tiers¹ tonnes | Load kN/m² | Pile grid m | Slab² mm | Piles² mm square | Slab RM/m² | Slab RM million | Piling RM/m² | Piling RM million | Total RM/m² | Total RM million |
|---|---|---|---|---|---|---|---|---|---|---|---|
| 1 | 15 / 10 | 134 | 2.25 × 2.25 | 225 / 275 | 350 / 400 | 477 | 2.253 | 1,831 | 8.651 | 2,308 | 10.903 |
| 2 | 15 / 10 / 10 | 187 | 2 × 2 | 225 / 275 | 400 / 400 | 491 | 2.318 | 2,731 | 12.906 | 3,222 | 15.224 |
| 3 | 25 / 15 | 165 | 2 × 2 | 200 / 250 | 350 / 400 | 481 | 2.274 | 2,241 | 10.590 | 2,723 | 12.865 |
| 4 | 25 / 25 | 206 | 2 × 2 | 250 / 300 | 400 / 450 | 508 | 2.401 | 2,950 | 13.941 | 3,459 | 16.342 |
| 5 | 25 / 15 / 15 | 226 | 2 × 2 | 250 / 325 | 450 / 450 | 572 | 2.702 | 4,112 | 19.430 | 4,684 | 22.132 |
Zone B · Stacking of production material
Source cost-schedule floor area: 4,725 m²
| Option | Coil tiers¹ tonnes | Load kN/m² | Pile grid m | Slab² mm | Piles² mm square | Slab RM/m² | Slab RM million | Piling RM/m² | Piling RM million | Total RM/m² | Total RM million |
|---|---|---|---|---|---|---|---|---|---|---|---|
| 1 | 25 | 81 | 2.5 × 2.5 | 200 / 225 | 350 / 350 | 418 | 1.974 | 1,334 | 6.305 | 1,752 | 8.280 |
| 2 | 15 | 104 | 2.5 × 2.5 | 225 / 275 | 350 / 400 | 488 | 2.306 | 1,381 | 6.526 | 1,869 | 8.832 |
¹ Coil tiers are listed from bottom to top. ² Slab thickness and pile sizes are shown as internal / perimeter. Values are reproduced as reported in the source. Source schedule references to Note 7 are retained in the source image; no additional Note 7 is supplied on that visual.
Informed decisions from the outset
The exercise helped the client balance operational requirements with the cost of providing them. It established a considered basis for the design loads from the outset, avoiding reliance on a generic allowance that could provide unnecessary capacity in some areas or insufficient capacity in others.
STUDY BASIS / ORIGINAL ASSUMPTIONS
Reading the comparison
Material and cost basis
| Concrete grade | 35 |
|---|---|
| Concrete | RM370/m³ |
| Steel | RM5,200/t |
| 350 mm square pile | RM8,136/pile |
| 400 mm square pile | RM10,341/pile |
| 450 mm square pile | RM15,569/pile |
Precast concrete piles
Grade C50 · jacked-in installation.
| Size · length | Working load |
|---|---|
| 350 mm square · 48 m | 890 kN |
| 400 mm square · 48 m | 1,075 kN |
| 450 mm square · 54 m | 1,475 kN |
Area bases: the zoning plan labels Zone A as 4,756 m², Zone B as 5,424 m² and Zone C as 2,718 m². The Zone A and Zone B cost schedules each state 4,725 m². The source does not reconcile these figures; the unit-cost comparisons above follow the original Zone A cost schedule.
Illustrative options from the original design-stage study. Estimates use the study’s assumed rates and exclude pile caps and formwork. Pile sizes vary between internal and perimeter bays where shown. These options provide different storage capacities; the cost differences are not like-for-like savings or savings realised in construction.
Source: 23003_Loading study_rev 00_mkp.pptx · September 2023 · stacking, zoning and Zone A/B comparison sheets.